Explore a new 2026 ChinaPower report and digital dashboard analyzing trade disruption risks at the South China Sea’s eight major chokepoints.
The United Nations Conference on Trade and Development (UNCTAD) estimates that roughly 80 percent of global trade by volume and 70 percent by value is transported by sea. Of that volume, 60 percent of maritime trade passes through Asia, with the South China Sea carrying an estimated one-third of global shipping.1 Its waters are particularly critical for China, Taiwan, Japan, and South Korea, all of which rely on the Strait of Malacca, which connects the South China Sea and, by extension, the Pacific Ocean with the Indian Ocean. As the second-largest economy in the world with over 60 percent of its trade in value traveling by sea, China’s economic security is closely tied to the South China Sea.
Putting a Price on the Strait of Malacca
The 5.3 trillion-dollar question
As a vital artery of trade for many of the world’s largest economies, the South China Sea has garnered significant attention. The high concentration of commercial goods flowing through the relatively narrow Strait of Malacca has raised concerns about its vulnerability as a strategic chokepoint. Writings on the South China Sea frequently claim that $5.3 trillion worth of goods transits through the South China Sea annually, with $1.2 trillion of that total accounting for trade with the U.S. This $5.3 trillion figure has been used regularly since late 2010, despite significant changes in world trade over the last five-plus years.
In pursuit of an accurate estimation, ChinaPower constructed a new dataset for South China Sea trade using common shipping routes, automatic identification system (AIS) data, and bilateral trade flows. This approach relied on calculating a summation of all bilateral trade flowing through the South China Sea. ChinaPower found that an estimated $3.4 trillion in trade passed through the South China Sea in 2016. These estimates represent a sizeable proportion of international trade, constituting between 21 percent of global trade in 2016, but is nonetheless 36 percent smaller than the original $5.3 trillion.
The Significance of South China Sea Trade
For many of the world’s largest economies, the South China Sea is an essential maritime crossroads for trade. Over 64 percent of China’s maritime trade transited the waterway in 2016, while nearly 42 percent of Japan’s maritime trade passed through the South China Sea in the same year. The United States is less reliant on South China Sea, with just over 14 percent of its maritime trade passing through the region.
| Country | % Share of World GDP | Trade Value through South China Sea (USD billions) | South China Sea Trade As % of All Trade in Goods |
|---|---|---|---|
| United States | 24.5 | 208 | 5.72 |
| China | 14.8 | 1470 | 39.5 |
| Japan | 6.53 | 240 | 19.1 |
| Germany | 4.58 | 215 | 9.00 |
| United Kingdom | 3.46 | 124 | 11.8 |
| France | 3.26 | 83.5 | 7.77 |
| India | 2.99 | 189 | 30.6 |
| Italy | 2.45 | 70.5 | 8.14 |
| Brazil | 2.37 | 77.3 | 23.4 |
| Canada | 2.02 | 21.8 | 2.67 |
| CSIS ChinaPower Project | International Monetary Fund | |||
The frequent citing of the $5.3 trillion figure in various publications implies an overwhelming concern among the media, scholars, and governments that a disruption of South China Sea trade would precipitate a global economic crisis. Concerns surrounding the $5.3 trillion figure are often tied to suspicions that China’s growing regional influence may embolden Beijing to disrupt commercial shipping. While certain contingencies may prompt China’s leaders to take coercive action, this possibility is less likely during peacetime.
China’s reliance on the South China Sea leaves it vulnerable to maritime trade disruptions. In 2003, then-President Hu Jintao drew attention to the potential threat posed by “certain major powers” aiming to control the Strait of Malacca, and highlighted the need for China to adopt new strategies to address this concern. Thereafter, the Chinese media drew significant attention to the potential risk outlined by Hu Jintao and Chinese scholars stressed the need to solve this “Malacca Dilemma” by exploring alternative shipping routes.2
Given the significance of the South China Sea for Chinese trade, Beijing may be more inclined to take steps to preserve the free flow of trade than it is to disrupt regional trade flows. Even under extreme hypothetical conditions where Chinese capabilities expanded to the point where it was capable of letting its own commerce pass while stopping that of other countries, such a move would be risky. Long-term interference with shipping traffic would increase insurance premiums on commercial vessels and force shippers to consider more expensive trade route alternatives. This is not to say that such a scenario is impossible. Dire circumstances may compel China to take disruptive action, but this would come at a considerable financial cost to China, greatly degrade China’s standing among other countries, and could precipitate an assertive response by outside powers.
Calculating South China Sea Trade
Reliably calculating the value of trade that passes through the South China Sea is essential for assessing its geopolitical significance. A reasonable estimate can be calculated by considering bilateral trading partners with trade that is likely to transit the South China Sea. For instance, much of Europe’s trade with China rounds the Cape of Good Hope before crossing the Indian Ocean and entering the South China Sea via the Strait of Malacca.
Country-level bilateral trade value data from the International Monetary Fund’s Direction of Trade Statistics (DOTS) provides a good starting point for evaluating the value of these trade paths, but importantly DOTS is inclusive of trade via all modes of transportation – land, sea, and air. Consequently, it was necessary to draw specific maritime trade data (where available) directly from government statistical databases.
The sum of all these bilateral values yields an unadjusted estimate of the total maritime trade passing through the South China Sea. This method produces an estimated value of $2.7 trillion for 2009 and $3.5 trillion for 2010 – both of which are significantly lower than the $5.3 trillion figure that first emerged in late 2010.
Although these unadjusted estimates more accurately represent the value of South China Sea trade than the $5.3 trillion figure, this approach still overestimates the value of trade. It assumes that all maritime trade between country pairs that use the South China Sea travels through the waterway. For instance, this estimation includes all maritime exports from the United States to China even though some of this trade – especially a large portion of trade from the West Coast of the United States – does not enter the South China Sea.
Nearly 40 percent of China’s total trade in 2016 transited through the South China Sea.
Estimating more refined figures required isolating the share of maritime trade that likely transit through the South China Sea. This was accomplished by analyzing AIS data provided by Windward, a maritime data and analytics company, over a 60-day sample period.
This approach offers enhanced precision. For instance, the unadjusted calculation assumed that all of Japan’s maritime exports to Indonesia traveled through the South China Sea. However, AIS data revealed that only 72.9 percent of trading vessels that departed Japanese territorial waters and headed towards Indonesia passed through the South China Sea. Similarly, only 16.2 percent of vessels traveling from Chinese territorial waters to the U.S. traversed the South China Sea. These ratios were applied as modifiers to specific trading pairs, providing a final estimate.
Disrupting South China Sea Trade
While there are several major transit routes or sea lines of communication (SLOC) that offer entry into the South China Sea – the Sunda Strait and the Lombok Strait among them – the Strait of Malacca is by far the most widely used. It is the shortest and therefore most economical passageway between the Pacific and Indian Oceans. There are a variety of scenarios that could disrupt shipping traffic and endanger commercial vessels passing through the Strait of Malacca. A short-term peacetime disruption would force vessels to either wait until access is reestablished or consider using an alternate route, while a long-term disruption could have far-reaching consequences for the trillions of dollars of goods that transit the South China Sea each year.
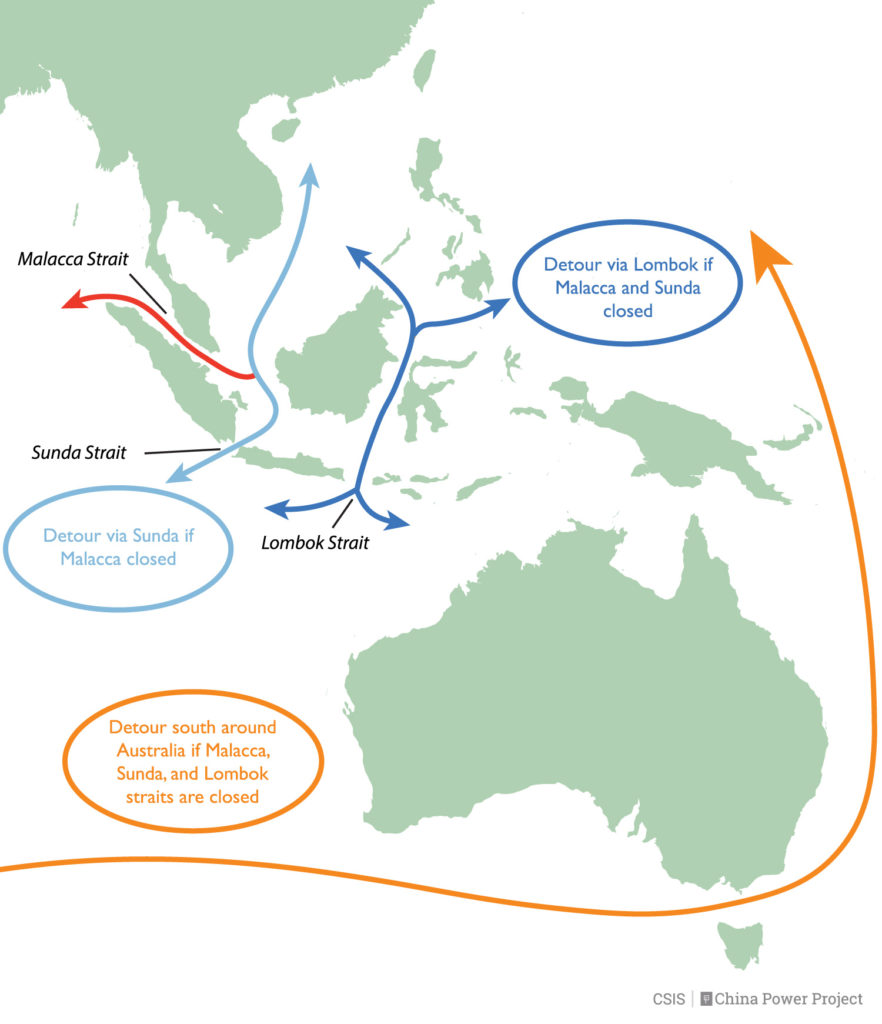
When considering a short-term peacetime Strait of Malacca closure, the added costs of rerouting can be estimated by calculating average daily voyage costs of various vessels. Assuming that tankers and bulk carriers exceeding 100,000 deadweight tonnage (DWT) detour through the deep-water Lombok Strait and that all other smaller transiting ships use the more proximate but shallower Sunda Strait, a week-long closure of the Strait of Malacca would result in an estimated $64.5 million in additional shipping costs.3
While an additional $64.5 million in shipping costs is significant, this would represent just 0.08 to 0.10 percent of the average weekly value of trade value that passes through the South China Sea. Over the course of a year, the costs of a week-long closure would drop to just 0.0015 to 0.0019 percent of annual trade passing through the waterway.
In the case of multiple SLOC closures, rerouting all shipping for one week through the Lombok Strait would cost approximately $119 million. A worst-case planning scenario entails all three straits (as well as other possible Southeast Asian SLOCs) being unavailable for commercial traffic, forcing vessels to sail around the southern coast of Australia before pushing north into the Philippine Sea. This would be analogous to traders rerouting around Africa when the Suez Canal was closed from 1967 to 1974, and would carry a considerable monthly cost of $2.8 billion.
| Estimated Cost to Reroute All Malacca Traffic (Million USD) | ||||||
|---|---|---|---|---|---|---|
| Sunda+4 | % of SCS trade over period | Lombok | % of SCS trade over period | Australia | % of SCS trade over period | |
| Daily | 9.21 | 0.08-0.10 | 17.00 | 0.15-0.18 | 92.98 | 0.80-1.01 |
| Weekly | 64.49 | 119.03 | 650.85 | |||
| Monthly | 279.46 | 515.80 | 2,820.35 | |||
| CSIS ChinaPower Project | ||||||
The impact of a short-term peacetime SLOC closure for a specific economy would vary, but the global economy would not come to a standstill. Trade would likely continue to flow, despite increased costs. Although the financial burden of a short-term peacetime closure at the Strait of Malacca may be manageable, a host of secondary factors make it difficult to apply the offered estimates to long-term closure lasting several weeks or longer.
For instance, if the Strait of Malacca was designated a war risk area due to ongoing unrest, the price of war risk premiums – insurance bought to protect against the risk of loss in likely conflict zones – would dramatically increase. War risk premiums correlate to hull values, and in many cases a starting point for coverage is pegged at 0.1 percent of a vessel’s hull value.
Hull pricing information is limited, but figures provided by UNCTAD in 2011 suggest that monthly war risk coverage for all traffic transiting the Strait of Malacca in that year would start at a cost of roughly $167 million.4 This should be understood as a rather low estimate as traffic through the waterway has increased 13.9 percent since 2011 and these costs would likely rise in the event of a prolonged conflict. After the Gulf of Aden was classified as a war risk area due to piracy in 2008, war risk premiums surged from $20,000 to $150,000 per voyage in 2010.5,6 These costs, in combination with the multitudinous risks associated with sailing through a conflict zone, may prompt shippers to significantly reroute commercial traffic.
After the Gulf of Aden was classified as a war risk area due in 2008, premiums surged from $20,000 to $150,000.
A long-term Strait of Malacca closure could also precipitate globally-reaching supply chain disruptions, especially among interregional trade routes and multinational production hubs that are geographically tied to the South China Sea. The countries of Southeast Asia would be particularly vulnerable. A hypothetical long-term closure may have a similar effect as the 2011 Thailand floods, which inflicted up to $32 billion in damages to Thailand’s manufacturing base. In particular, the damage done to Thailand’s hard-drive manufacturing sector crippled the global hard-drive supply chain and dropped worldwide production by 30 percent, while global prices skyrocketed by 190 percent.
Energy or commodity disruptions could have even more far-ranging economic consequences for the global marketplace. This is especially true for China – the world’s top crude oil importer. In 2016, almost 80 percent of China’s oil imports passed through the South China Sea via the Strait of Malacca. For an oil-hungry country like China, a long-term closure would present a worrisome economic and political scenario.